Pound Pessimism - Part 2

Financial Literacy
~84% don't have a S&S ISA
The lack of financial literacy is an endemic in the United kingdom. ~16% of UK adults currently hold a Stocks and Shares ISA (Individual savings account), ~17% have never heard of a Stocks and Shares (S&S) ISA.
~67% of the population have heard of a S&S ISA but don't own one, with 3/5 individuals aged 55 and over not having one, a further 25% of those who have heard of it do not understand it.
A possible explanation is boomers (Born between ~1945-65) who attained wealth though property/real estate, don't see the need for a S&S ISA and possibly see the stock market as inherently risky.
The observable risk here is concentration in the Pound Sterling, with rising interest rates, those older than 55 overly exposed to housing as an asset class which is generally illiquid, taking 4-6 months minimum to sell and complete.
Understand what it means to truly diversify and invest, protect your wealth.
Technicals study price
1980, Pound Crash ~57% in 5 years
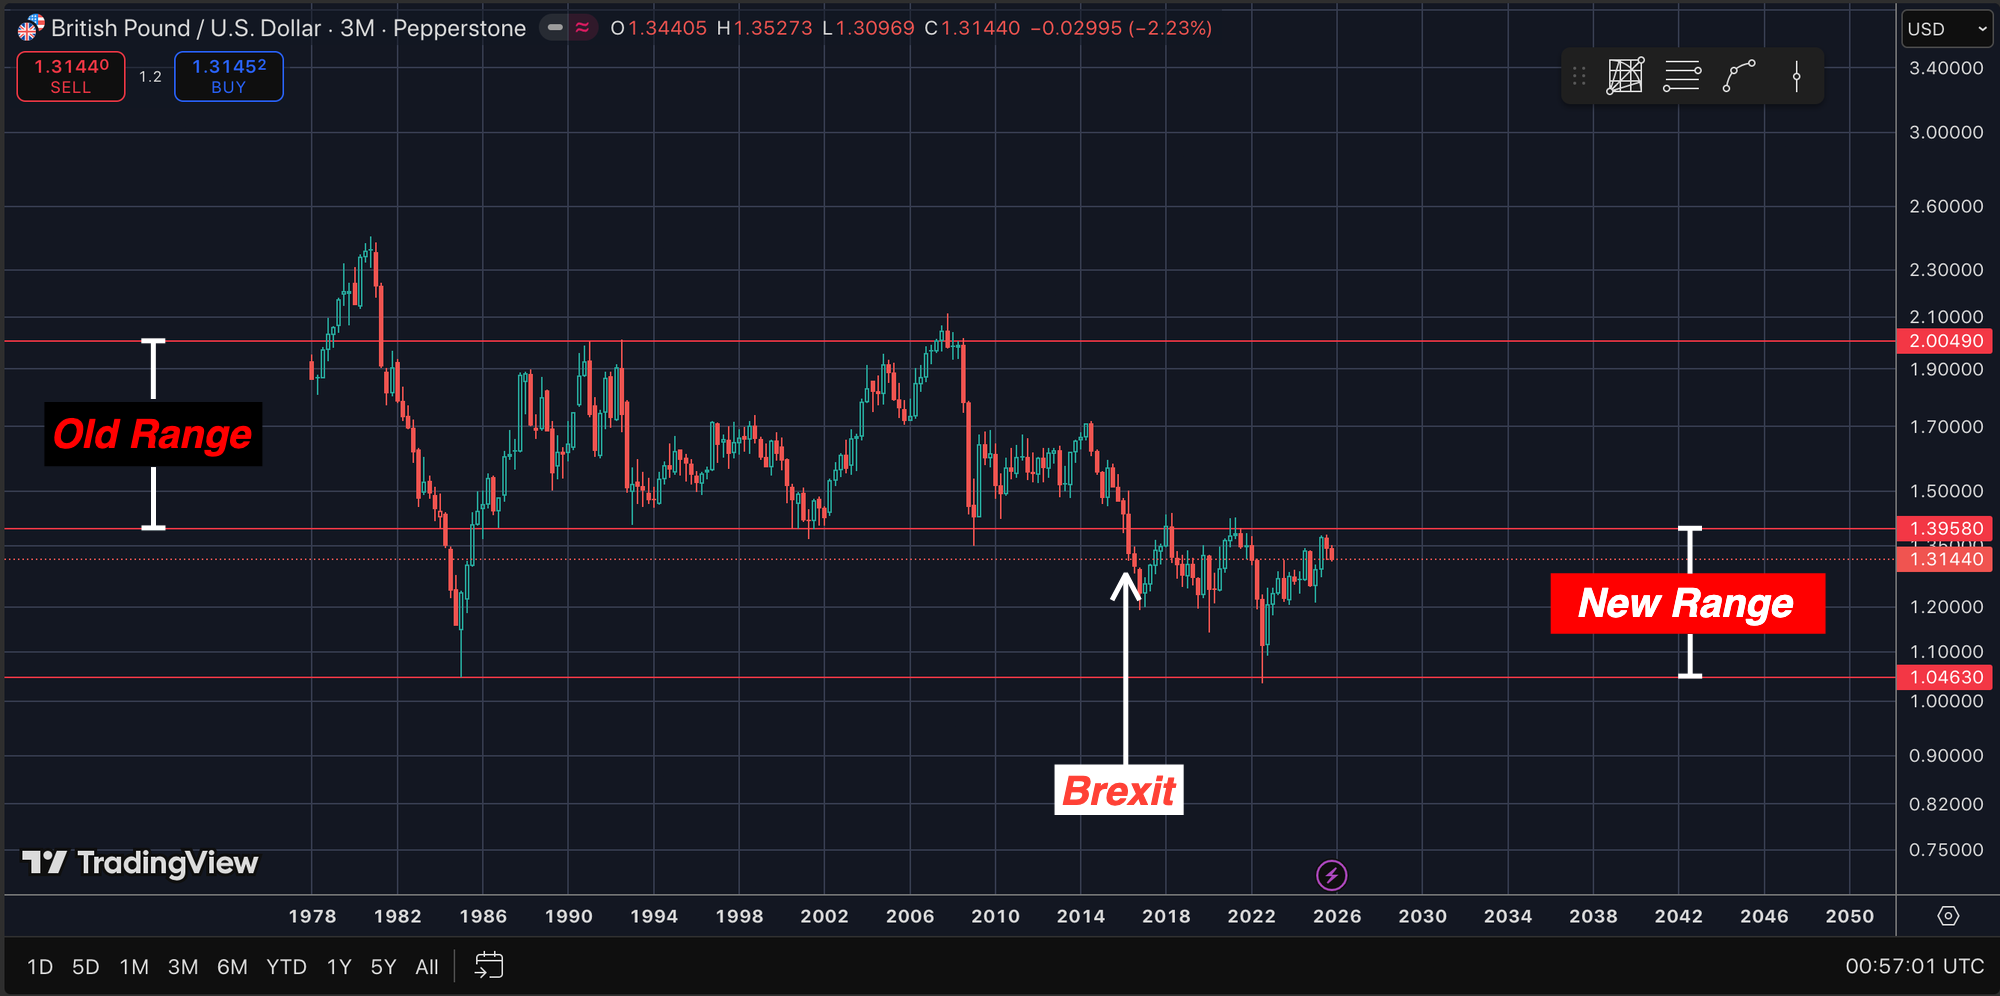
Setting the scene, current day sterling has broken a key support, now turned resistance struggling to breakthrough ~$1.40 (Fig 1).
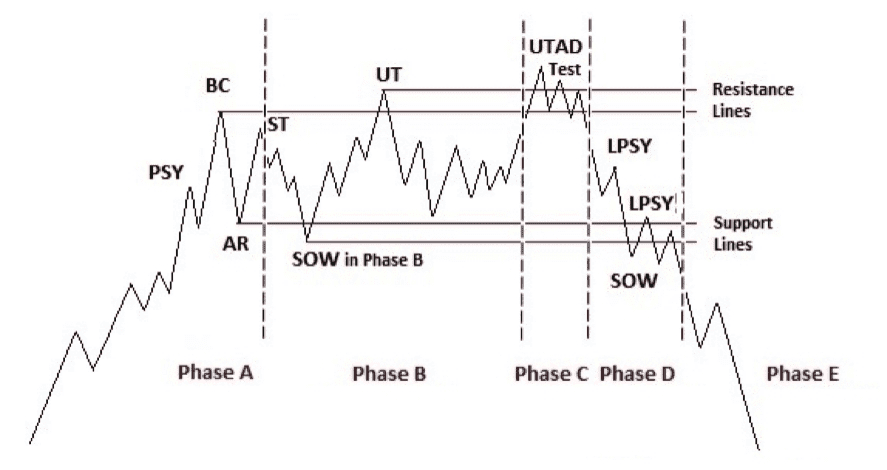
The most pertinent technical fractal that springs to mind is Wyckoff distribution. We are currently approaching SOW - signs of weakness in phase D (Fig 2).
Previous phase C would be the elusive peak exchange rate of £1=$2 in 2007 never to be seen again.
Phase E is markdown, ranges break with momentum and large volume, typical drawdown and minimum price target is generated by the height of the range ~25% which gives a price target of $0.78, ~40% depreciation from here.
Typical drawdowns can take a minimum of 9 months on average, with ~25-30% crashes most recent being 2022, 2008, 1992. Worst being 1980 where inflation was at 18%, GBPUSD crashed ~57%, over half in 5 years.
Furthermore, a 45 year cycle frequently sited by W.D Gann is present, noting that 45 years is derived from the sum of digits 1 through 9 and is tied to planetary conjunctions, squares, and oppositions. It frequently appears in economic theory, the Kondratiev wave, or K-wave, is a hypothesised long-term economic cycle lasting between 45 and 60 years, characterised by alternating phases of high growth and slow growth driven by technological innovation.
Corroborates timing window mentioned previously for crash forecast.
Investor Aims + Objectives
In summary, for the average British citizen since the COVID-19 pandemic, your savings in GBP have lost a third. Presently, Truflation has reported aggregated UK inflation since 2020 compounded ~34%, USA ~28%.
As an investor your aim should be to achieve a compound annual growth rate (CAGR) of 15% minimum on capital invested, just to keep up with inflation.
Historically over last 40 years, S&P500 has produced an average annual return of ~10%. This was all during the best risk adjusted return over the last 40 years for stocks and bonds, in an environment where interest rates were falling down to ~0% in 2020. Passive investing did not exist before this and was only made possible by falling interest rates.
Recent performance over the last decade is higher closer to ~14%, however the index consisting of 500 companies is now heavily weighted towards technology sector composing of ~35% of the index, the top ten companies make up ~40% of the S&P500, the highest level in 93 years according to Goldman Sachs.
We are 4 years away from the 100 year cycle of the great depression, infamous 1929 stock market crash, 2.5 months 50% lost, by the end of crash ~90%
Famous last words, this time is different.
A forewarning for those passively investing, diversify within your portfolios and across assets classes, look for uncorrelated returns. Always protect your capital.
Generational Wealth is achieved at a CAGR of 30% minimum, doubling investments in under 2.5 years; 9 years that's a 10x return or a 1000%.
eg. £100,000 is worth 7 figures in 2034
Take your initial capital today and add an extra Zero on the end.
Outperformance
Current 2025 Sharpe: 2.6 Sortino: 3.2
How I am investing and positioned currently is reserved for premium members. All I can share openly at this time is my year to date performance is ~59%, with a high of ~66%, April 2025 Trump tariff drawdown of ~5%.
Performance metrics over 1 year like above are irrelevant, high of ~66% produced Sharpe: 3.1 Sortino: 3.7, Warren Buffet ~0.79, Long-term Sharpe S&P500 ~<1.0.
For every unit of risk taken, the investment provides x amount of excess return.
Sharpe Ratio: Measures realised returns (as a %) against the risk taken (standard deviation of return). A high Sharpe ratio indicates that the return for the period was high relative to the risk taken. However it penalises upside volatility.
Sortino Ratio: measurers realised returns (as a %) against the variation in negative returns. A high Sortino ratio indicates that the return for the period was high relative to the risk taken. Only takes loss making days into account when measuring the risk taken, compares performance relative to the downside deviation, rather than the overall standard deviation, of a portfolio’s returns, rewards upside volatility.
Disclaimer
The content is for informational purposes only; you should not construe any such information or other material as legal, tax, investment, financial, or other advice. Please refer to our
Terms and Conditions.